
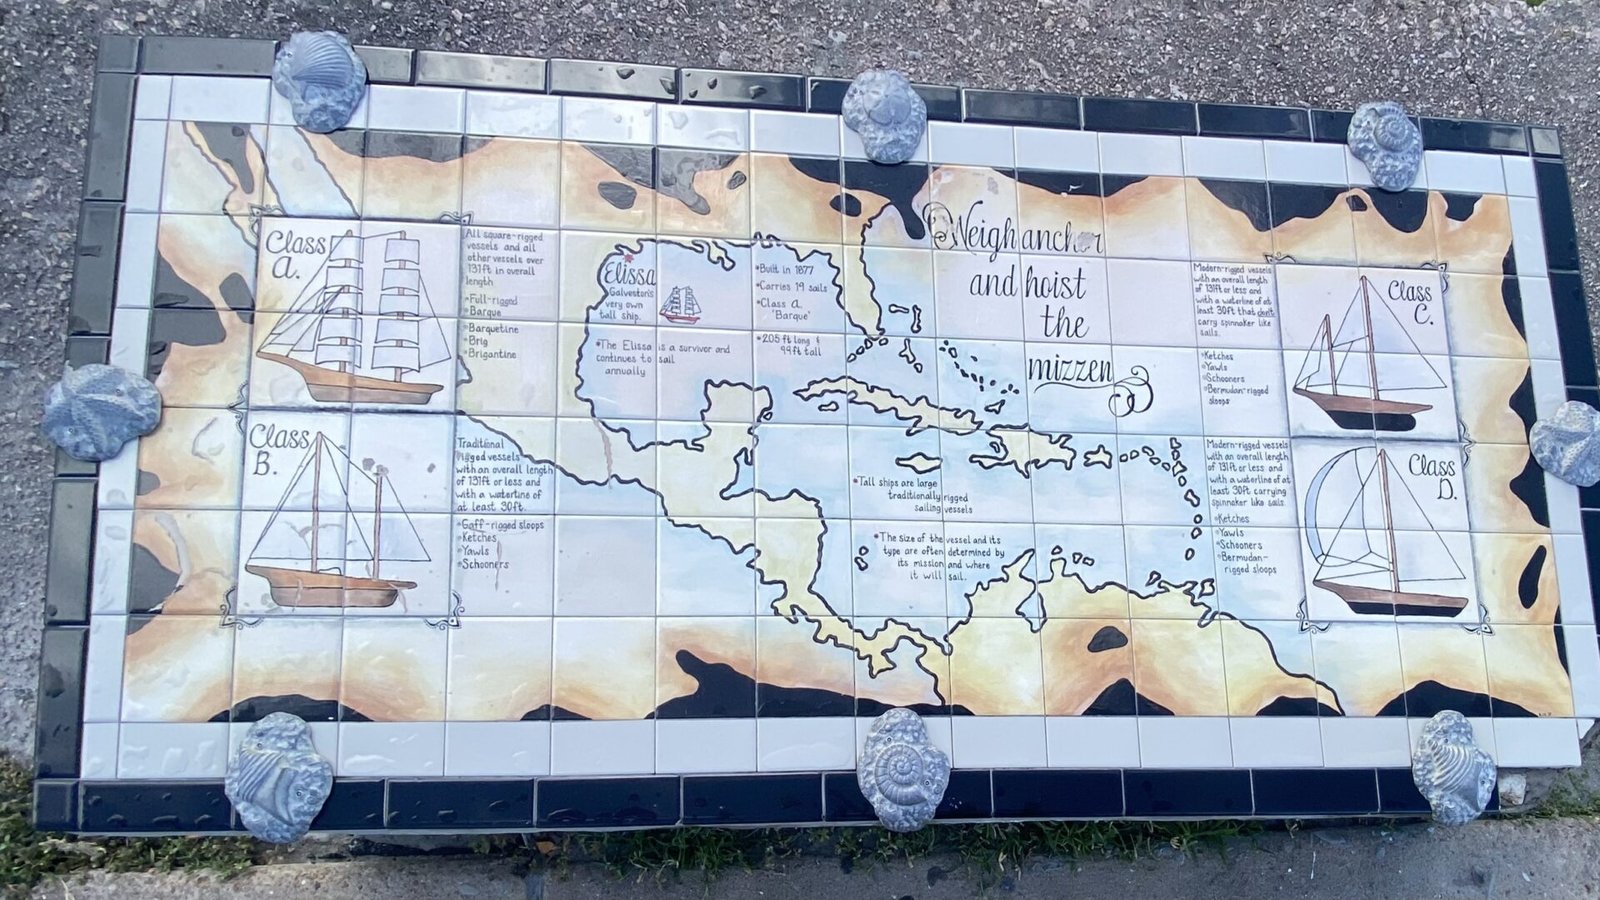
Eric Lund said “Came across this eye-catching map at my eye doctor’s office this week and had to share it with you.” Well I am glad he did share it, what a cracking map in the wild! Here’s a bit more detail.

This piece was designed by Tad Bradley, the accompanying description says
‘Snellen’ and “Tumbling E’ eye charts: Ocular Cartographic Study
Although trained and currently practicing architecture at SMA Architecture + Design, Tad Bradley remains an artist and educator. He is continually fascinated with nature and the human body. The complexities within and between these are continually inspirational to investigate through art.
The scale of the eye charts is inspired by the art movement of hyperrealism. In reproducing the eye charts at such a large scale, they begin to hold a greater weight within space, possibly reminding us the value of our eyesight and the incredible value this sense and these organs bring to our lives.
The maps and text you see were originally printed in 1906. The series of oversized manuscripts, which focused on separate geographic regions, were titled ‘Geologic Atlas of the United States’, edited by S.J. Kubel. The maps here, in the waiting area, have been scanned and reprinted on metal panels in order to protect them from UV degradation from solar exposure.
Eye charts have been the tool opticians have used for many years to assist in initially analyzing visual acuity. Exploring a tool within art invites a different awareness of not only the object but the process of how it is used. These eye charts were created for specific groups of people. The Tumbling E chart is used for those unable to read or never learned the Latin alphabet. The shapes and their direction are universal to all. The Snellen eye chart contains eleven rows of diminishing Latin letters to assess vision.
Each 11″ x 11″ plywood panel has two layers of hand-cut paper [1906] to create visual contrast for viewers.
“I chose the text pages from the Atlas to expose the Tumbling E chart. I was interested in exploring the contrast of the text-heavy pages and their visual relationship to the simplified ‘E’ shapes. The maps, on the other hand, are filled with high-contrast colors and patterns, more easily revealing the letters of the Snellen eye chart.
One of my goals in creating this work was to analyze how we as humans experience the world, interact with one another, and stand alone as individuals. I hope that my work creates curiosity, questions and conversation”.


